
Running 50 AI agents without visibility into their behavior is flying blind. Here's the observability layer that tells me what's happening before a client has to.
For the first two months of running Ayla OS, I found out about problems the worst possible way: a client mentioned something looked off, or a task simply never happened and I noticed the gap days later. That is not a monitoring system. That is hoping.
Observability changed the entire relationship I have with the system. I stopped reacting to problems clients found and started catching problems before they became visible to anyone but me.
Logging tells you what happened after you go looking for it. Observability tells you what is happening right now, and flags the moment something deviates from normal. Most people build the first and think they have the second.
I had extensive logs for the first two months. They were useless in the moment because nobody was reading them until something had already gone wrong. Observability required a shift from passive records to active signals.
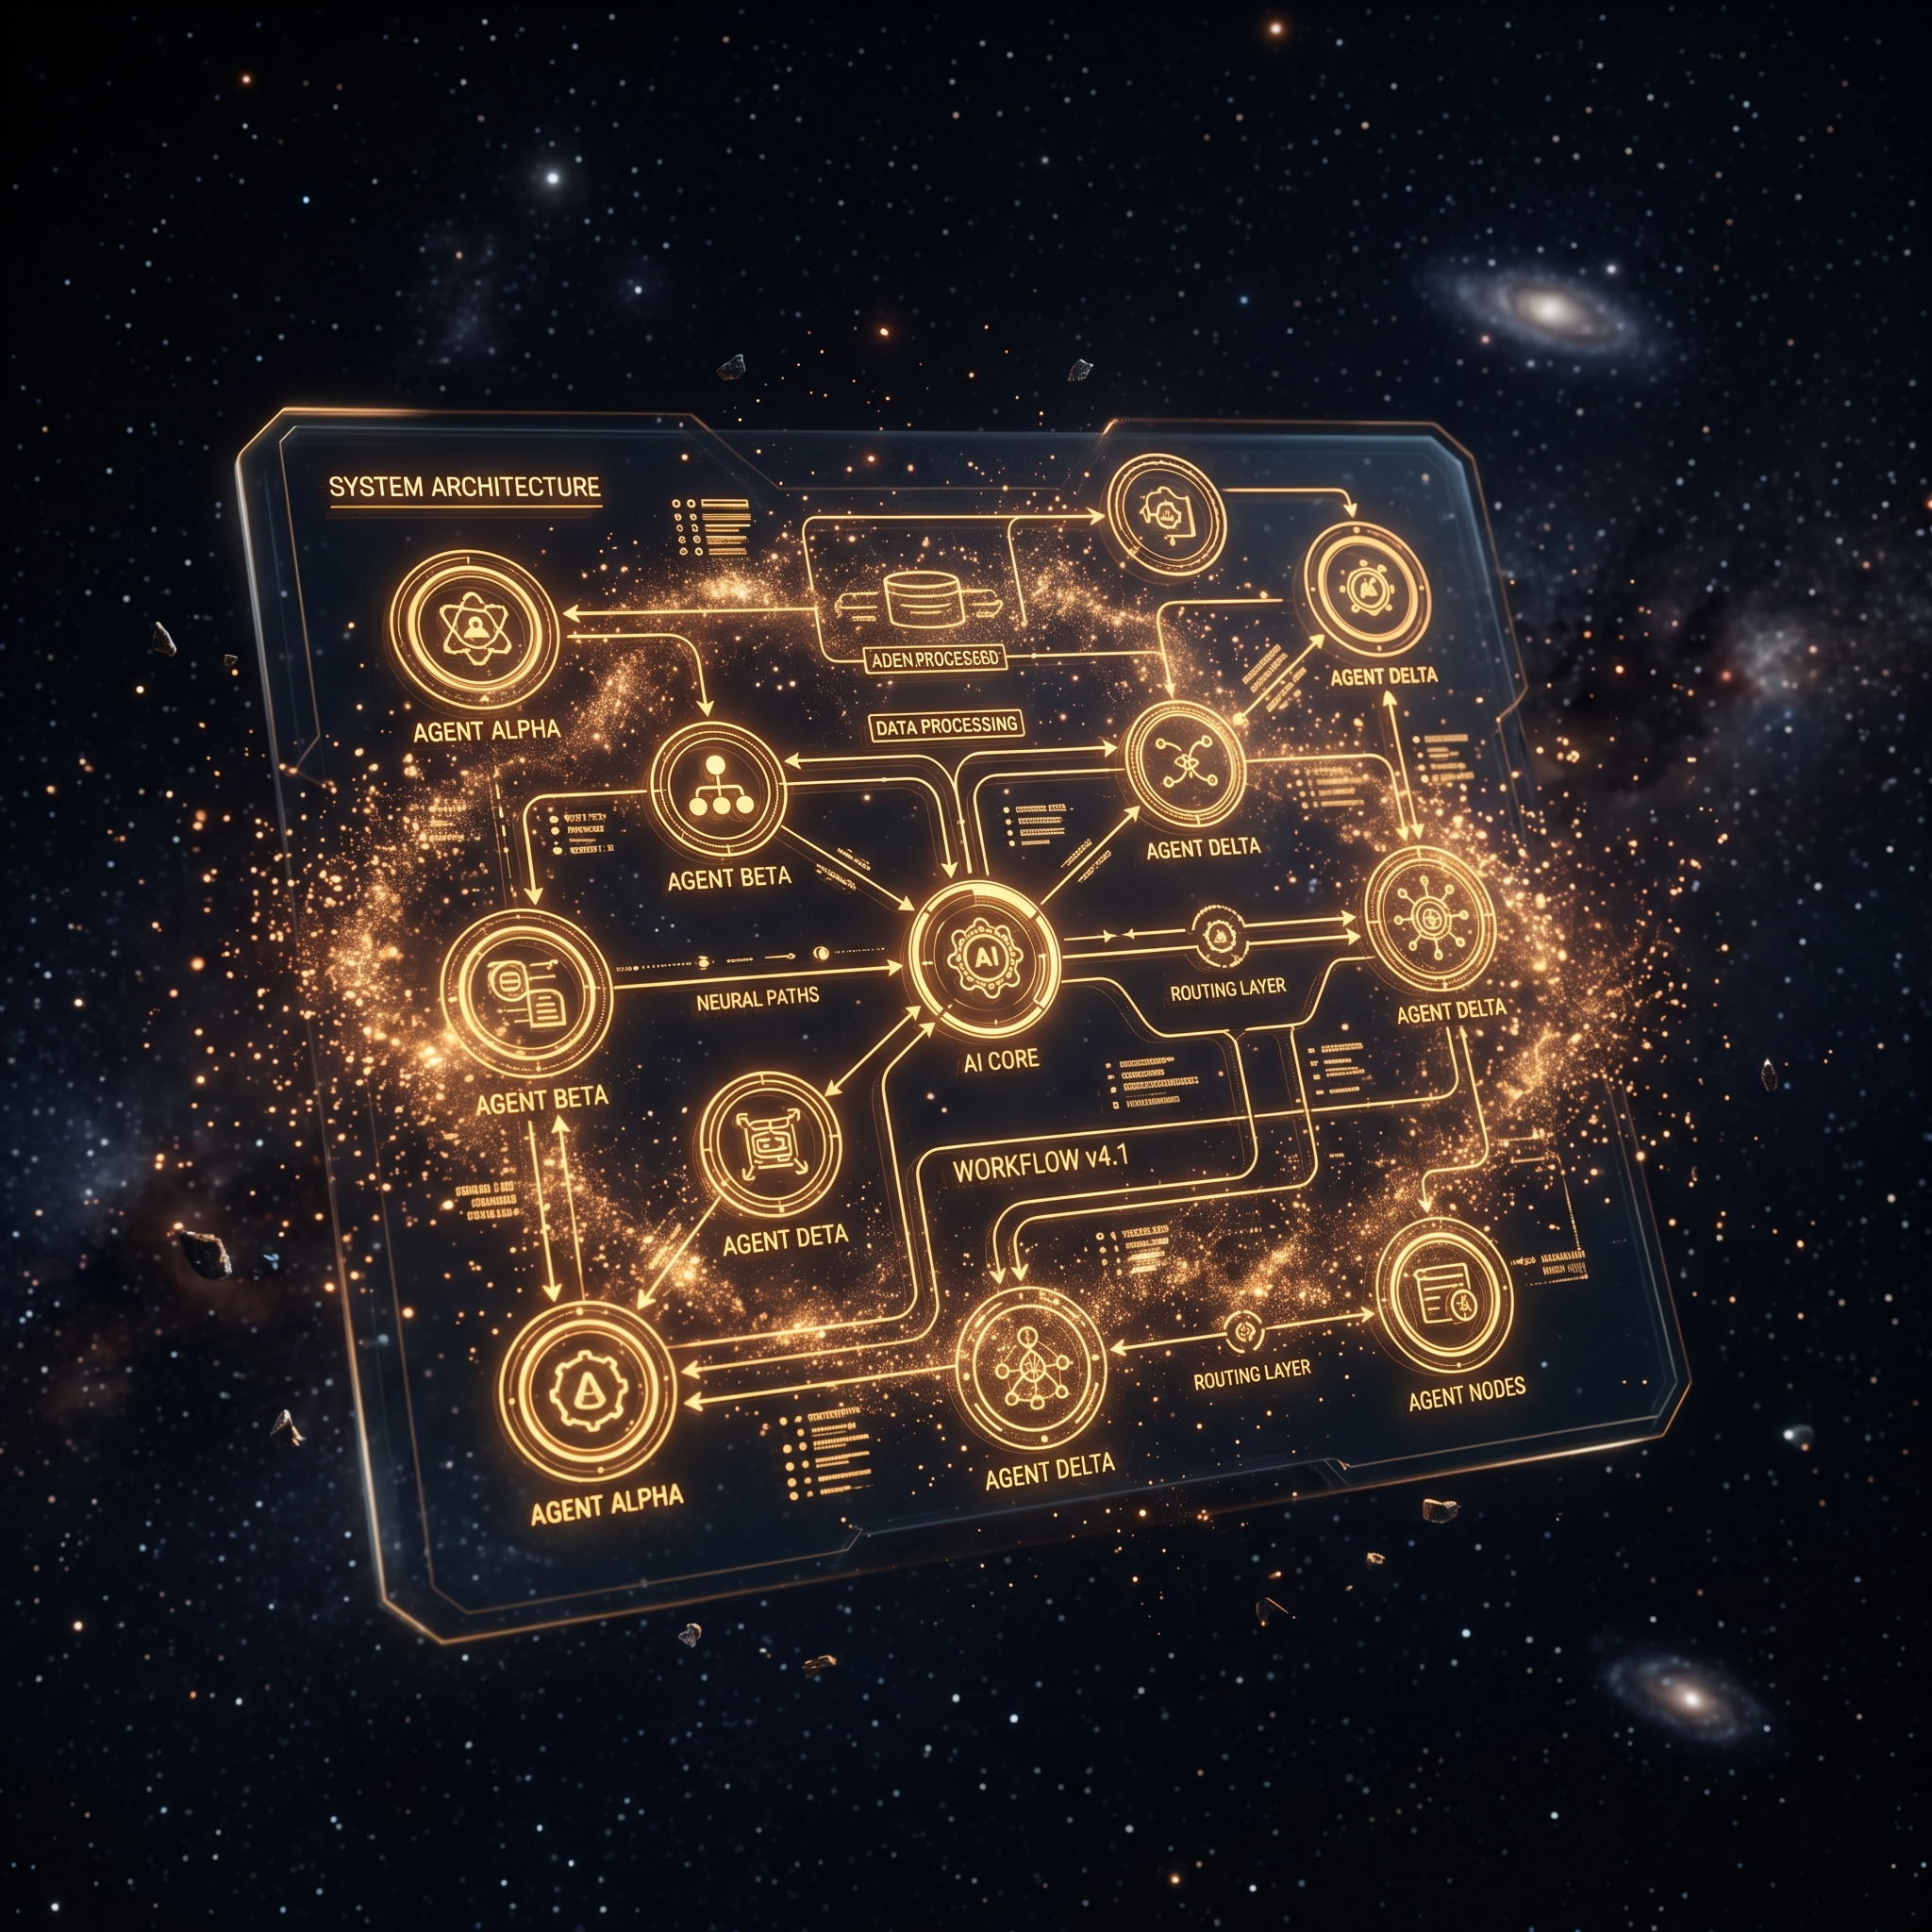
The exact architecture, memory layers, and delegation patterns I use to run 50 agents across two businesses.
Get the AI Agent Blueprint →Task-level state, not just task-level completion. Every agent reports not just “done” or “failed” but where it is inside a multi-step task: started, mid-execution, awaiting a tool response, completed, or stuck. A task that has been “in progress” for four times its normal duration is a signal on its own, even before it technically fails.
Throughput per agent, tracked as a baseline. Each agent has an expected volume: my content agent typically drafts three to five pieces a day, my invoice agent runs weekly. When throughput drops to zero or spikes to ten times normal, that is worth a look regardless of whether any individual task reported an error.
Latency percentiles, not averages. An average hides the outliers that actually matter. I track the 95th percentile completion time for every agent type. When that number creeps upward over a week, it usually means an upstream API has gotten slower, or a prompt change quietly made an agent do more reasoning than it used to.
Output quality spot checks, sampled automatically. A separate lightweight agent pulls a random sample of completed outputs each day and scores them against a short rubric: correct format, no obvious factual issues, tone consistent with the source material. This is not a replacement for human review, but it catches drift I would otherwise only notice weeks later.

I do not have a sprawling analytics suite. I have one dashboard with four sections: agents currently running, agents that failed in the last 24 hours, throughput compared to the 7-day average, and the dead letter queue count. That is it. Everything else is a drill-down from one of those four numbers.
Simplicity here was deliberate. A dashboard with forty metrics gets checked once and then ignored. A dashboard with four gets checked every morning because it takes thirty seconds and always tells me something useful.
My first version of alerting fired constantly, on every minor blip, and I trained myself to ignore it within a week. That is worse than no alerting at all, because it creates false confidence that someone is watching when in practice nobody is reading the noise anymore.
I rebuilt the thresholds around a simple rule: an alert should fire for something that requires action today, not something that is merely unusual. Failure rate above five percent, an agent silent for longer than its expected cycle, or the dead letter queue growing past ten entries. Everything else gets logged for the daily review, not pushed to my phone at 2am.
The real value of watching 50 agents closely is not catching bugs faster, although it does that too. It is being able to tell a client, honestly and specifically, what happened and why, before they have to ask. That specificity is what makes clients comfortable letting agents touch more of their operations over time.
You cannot scale trust in a system you cannot see into. Observability is what makes the scale defensible.
The blueprint includes the exact dashboard queries and alert thresholds I run across Ayla OS.

Subscribe to The Signal
One issue per week. The biggest AI build of the week, the top five videos worth your time, and an operator's read on what actually matters. For builders who ship, not dreamers who scroll.
No spam. Unsubscribe anytime. Just The Signal.